
DEBUNKING: "Women Radicalized While Men Stayed Normal"
The monthly installment in my series: nobody knows how to read data anymore!

Today’s publication is free. If you enjoy it, consider subscribing to my Substack.
I write 2-3 paid essays like this one every week. Paid subscribers also get exclusive access to my subscriber chat, audio podcasts, and even some old poems and songs from my days in Nashville thrown in from time to time.
You can join for only $10 per month or $45 per year!
I’m starting to think I should dedicate at least one article a month to the cause of teaching society how to interact with and read data—because boy can they not.
We talk a lot (though perhaps not enough) about the functional literacy crisis in the states, but I think most people imagine this only pertains to an individual’s inability to sound out words. In reality, the crisis goes much deeper. People who are functionally illiterate can often pick out words that they recognize and make an educated guess at how they sound or what they mean. They can even construct simple sentences. But they struggle to comprehend the meaning of complex writing or to connect the ideas presented within them.
Now do you see why so many people struggle to read basic data? It tracks. Reading data requires not only these abilities, but also the impulses to ask questions and tease out more than what’s being presented on the surface. Most data collection is done, after all, with an agenda. An agenda doesn’t necessarily mean the information will be incorrect, but it does mean it will have some bias and that consumers need to apply scrutiny to the findings.
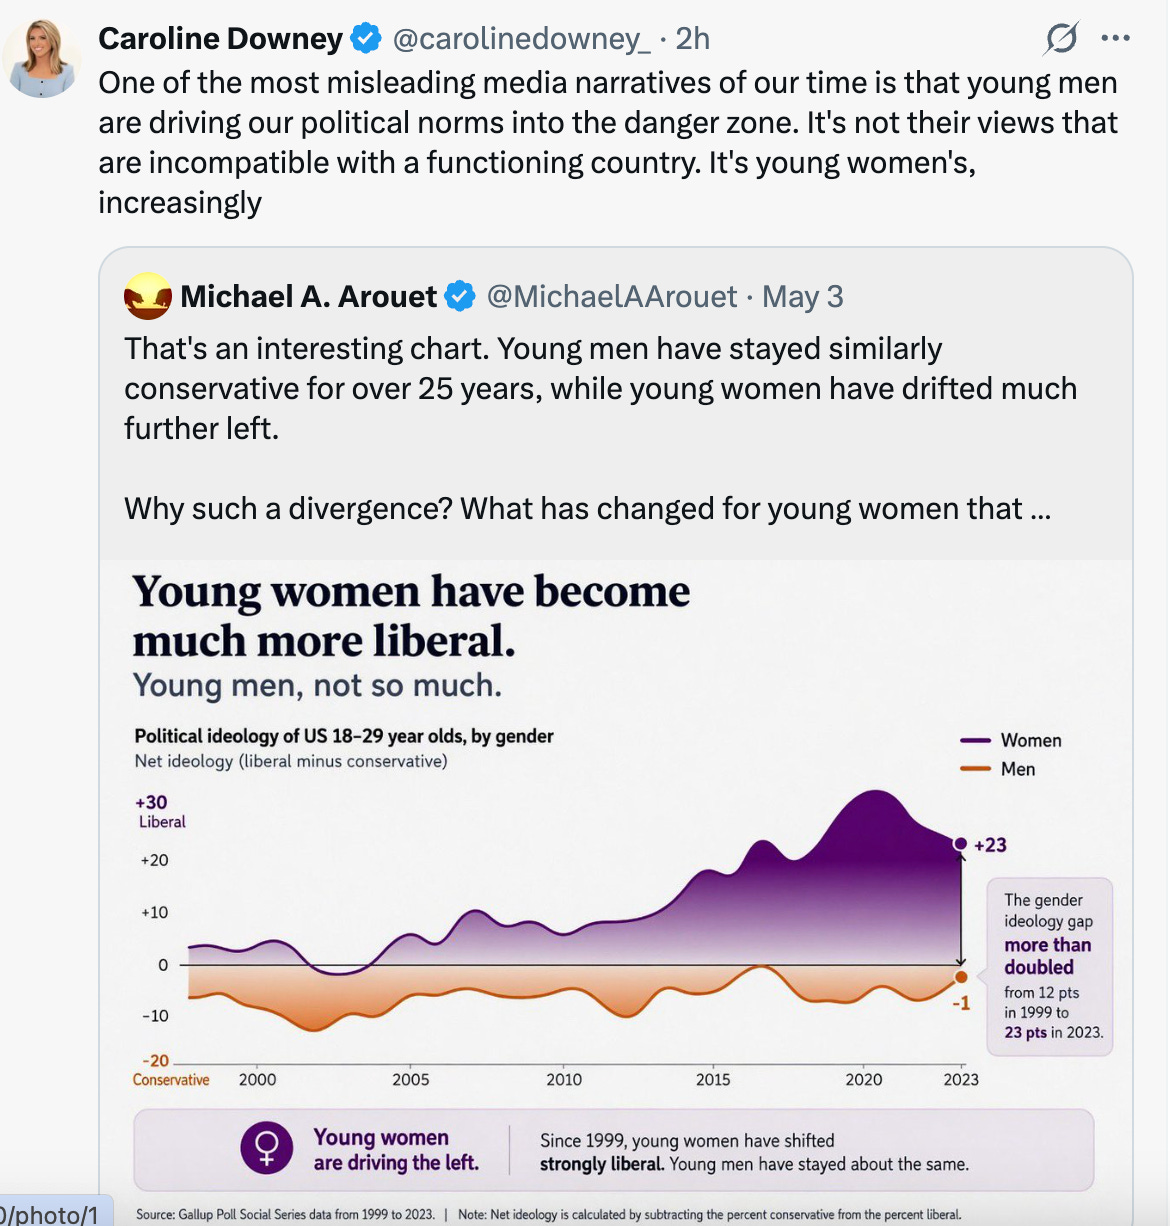
Let’s use this “study” that males frequently circulate online. The data’s headline claims that young women have become much more liberal in recent decades while men have barely budged in their political worldviews and have remained consistently conservative.
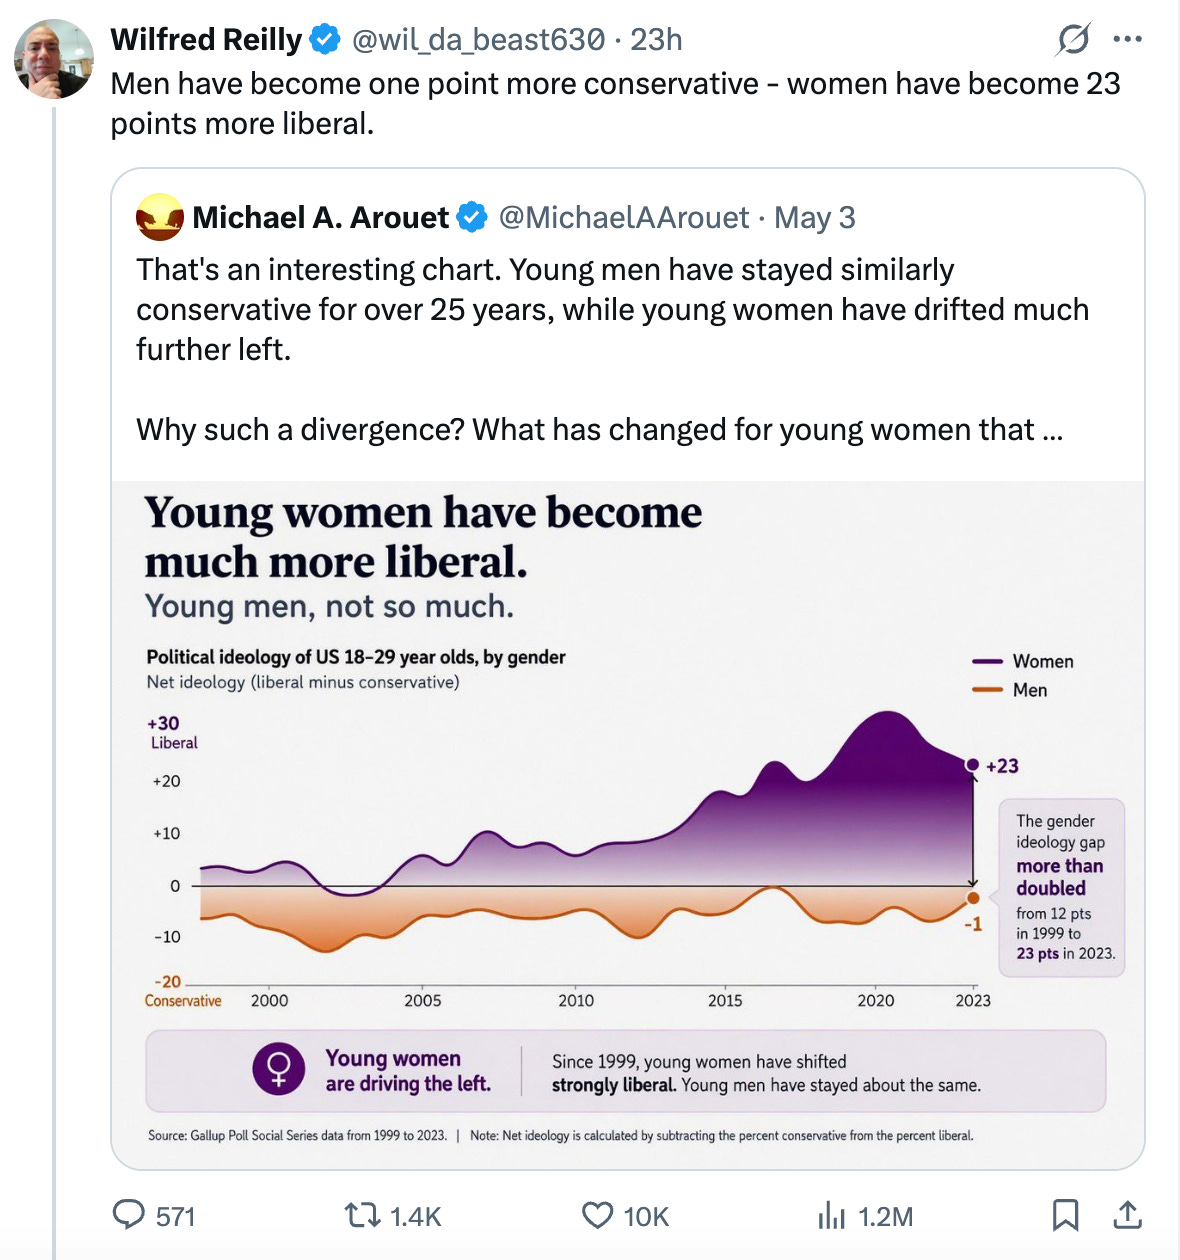
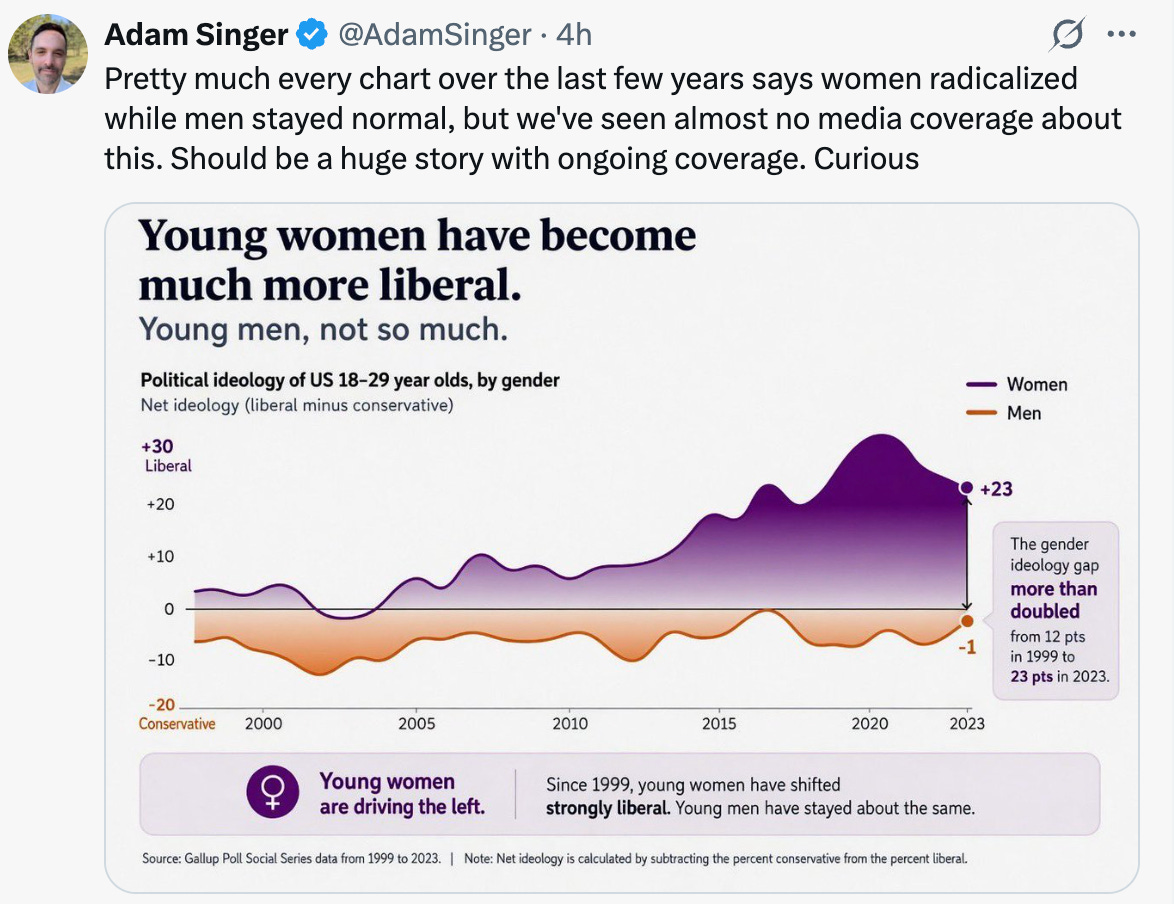
As you can see from these screenshots, the subheader is that the gender ideology gap more than doubled between 1999 and 2023, and the source for this information is the Gallup Poll. Gallup conducts pretty reliable surveys on the American public and is a trusted source, you can read more on their methodology here if you don’t want to take my words for it. Personally, I don’t have any reason to question their findings given their reputation, methods, and general lack of strong bias. Additionally, the information lines up with anecdotal information I already know. Women have been more likely to vote Democrat than men for many election cycles, so it doesn’t exactly seem headline worthy that Gallup found they are more left-wing.
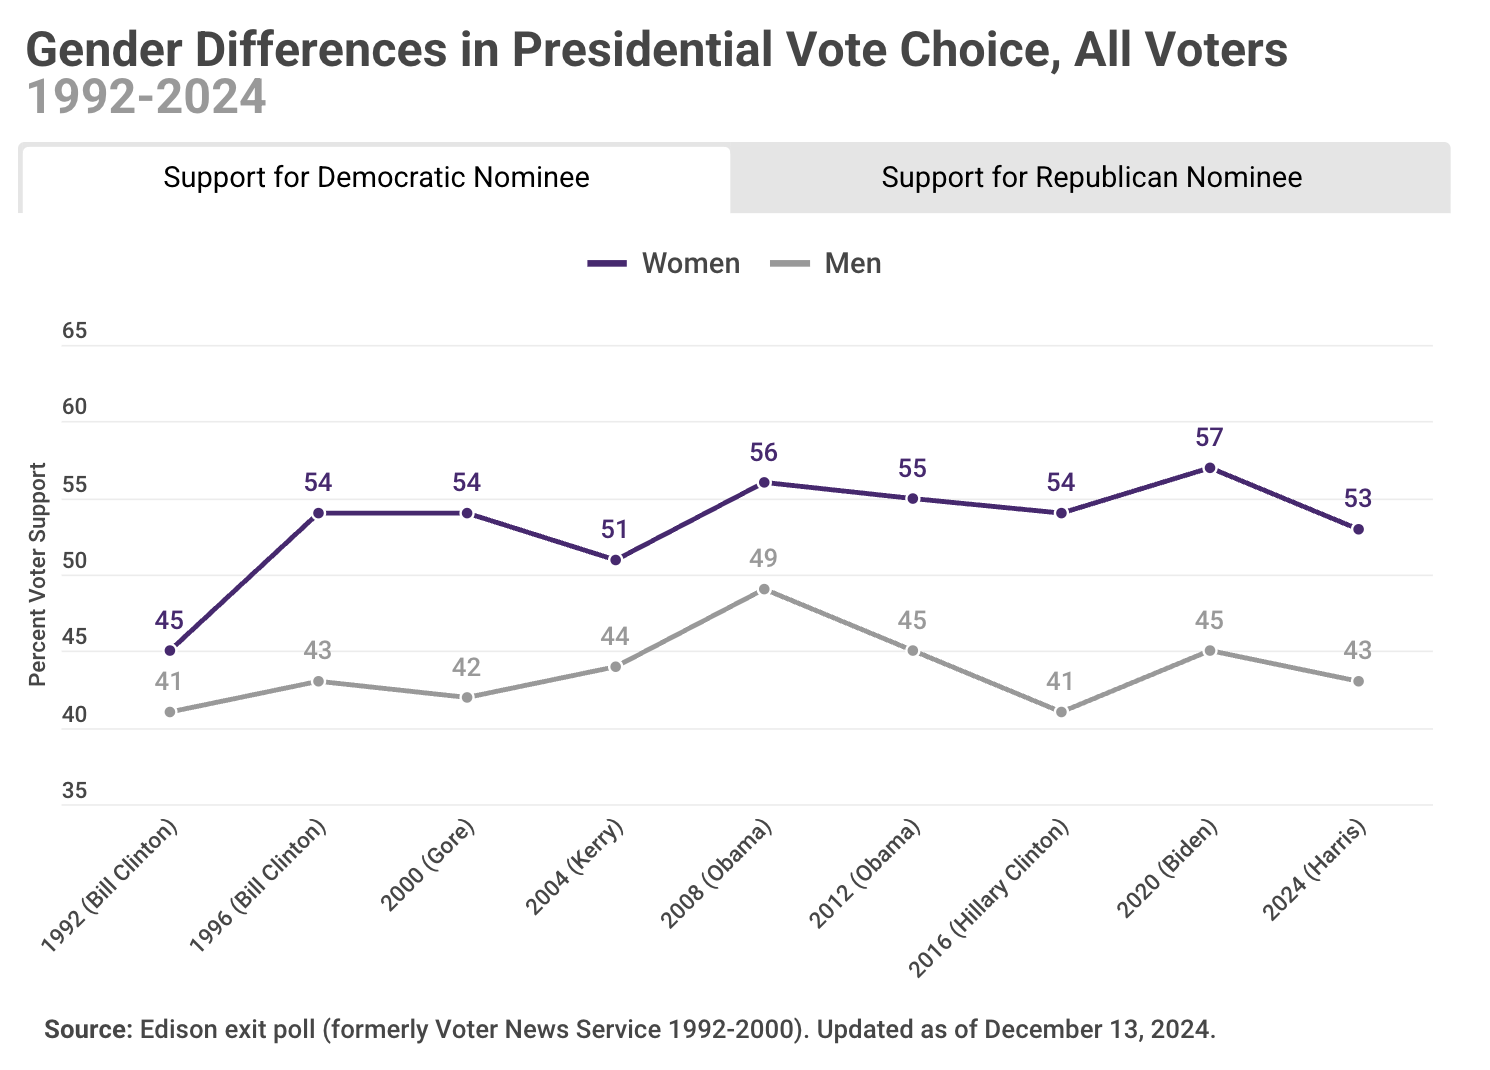
As you’ll note, the distance between men and women in this second graph doesn’t look quite so stark as the first graphic portrayed the divide. That’s because one poll was measuring how men and women felt about a small number of issues while the second one is measuring how they actually voted. For the record, even in 2024—a year where there has arguably never been a better case to vote against the Republican candidate—Kamala Harris won 51% of women’s votes.
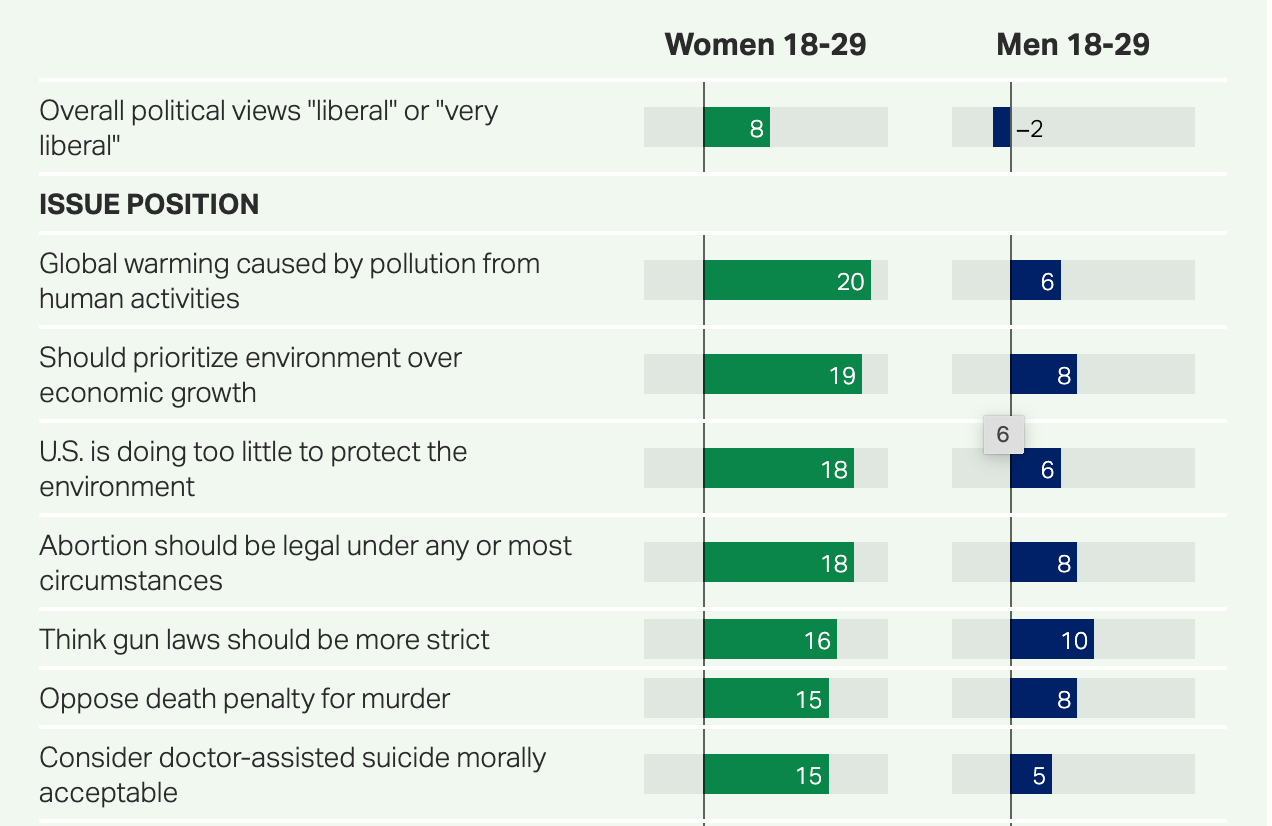
So what was the Gallup Poll measuring for if not women’s likelihood to reliably vote left? It actually only measured how women and men felt about a number of policy issues, including abortion, the environment, guns, and taxes. What they ultimately found is that women have become much more concerned about a handful of these topics over the past two decades. On primarily seven topics, their views had grown significantly more stringent.
Now, I’m going to be nitpicky here, but there are immediately problems with the headline that’s been attached to this data. As someone who is politically homeless and principled, something neither of the major two parties can claim, it’s easy to see that several of these topics are not really right vs. left wing.
There are people in both parties that believe global warming is caused by humans, that the U.S. is doing too little to protect our environment, that the death penalty is stupid public policy, and even that gun laws should be more strict (cough, President Trump). Therefore, using this information as a way to accuse women of becoming psychotic socialist freaks seems disingenuous at best, and more likely, a sinister attempt to undermine women in the political realm. Let’s keep digging in and I’ll explain.
First, I want you to ask yourself why men are so gleefully spreading this summary of the data around. What is the message you suppose they are taking away from it and want you to also glean? I have a few guesses.
The first goal is to suggest that women are flighty and easily persuadable. “Look how drastically they’ve changed their opinions in the past twenty years, they’re clearly unstable and emotional!” Some hope to take this line of thinking even further, particularly those already gunning for women’s rights in the first place. “See how quickly women have become radicalized? They’re the ones driving our country off a communist cliff, they shouldn’t be trusted with a vote.”
But again, the questions women actually answered in that survey revolved around pretty mainstream policies, and notably, ones neither party consistently represents. Secondarily, if people want women to be more right-wing, then perhaps they should do some outreach or present policies that would meaningfully address the issues they care about. The solutions to environmental concerns don’t have to be the Green New Deal, they could just as easily be nuclear energy, permitting reform, and allowing market innovations that can more expediently replace fossil fuels.
Mocking women for caring about the environment, or using that fact as a way to malign them as extremists actually makes you kind of nuts. The entitlement to women’s support is at root and it seems a lot on the right don’t believe they should have to compete for support.
Lastly, these results measure the opinions of young people today compared with young people of twenty years ago. So the outcomes don’t show that women are racing to the left en masse, they show that young women feel more strongly about some key issues than their moms did at their same age. I can think of a few reasons for why young women today might have strong stances on a good number of political fronts. Abortion rights have been under successful attack for a decade now. The impacts of climate change are hitting young people in a way that their parents only read about the potential for. And our information ecosystem is night and day compared with what people had in 2006. Practically everyone is more politically conscious, informed, and impacted by social networks pumping political takes into their brains day-in and day-out.
The second conclusion people who share this graph are hoping to convince you of is that young women are the political radicals, not the young men who are increasingly alt-right. “See, young men haven’t moved in their beliefs at all! They’re just nice country club Reaganites who want what’s best for the country you misandrist.”
This is quite frankly a laughable assertion that the right (and men) are quite obviously desperate for us to believe. But you don’t have to be a political wonk or even that great at reading data to see the obvious chink in their narrative here. While young men may still label themselves “conservatives” at similar rates as they did twenty years ago, the very definition of what it means to be a conservative has done a complete 180.
Since Trump entered politics like a wrecking ball, virtually everything the GOP used to stand for has collapsed. Conservatives used to believe in the Constitution and the rule of law, they wanted a smaller government, they at least pretended to care about individual liberty (albeit always very inconsistently). All of that is gone. Being a conservative today means refusing to say Trump can’t seek a third term in office, starting wars without congressional approval or public support, suing people who criticize you, letting the government take ownership stakes in companies, and decimating the economy with tariffs. Interestingly enough, the Gallup Poll didn’t ask men how they felt about any of this—but it’s a pretty solid bet those opinions look drastically different than those of conservative young men in early aughts.
More importantly though, the survey didn’t ask men their opinions on any of the issues that define the alt-right or the growing problem of political extremism amongst young men. Other surveys have…
Earlier this year, a global survey found Gen Z males were twice as likely as baby boomers to believe wives should obey husbands.
The same survey found 24% of young men saying women should not appear too independent or self-sufficient, compared with 12% of baby boomer men.
And 59% of Gen Z males said men were expected to do too much to support equality, compared with 45% of baby boomer men.
An August 2024 survey by Citizen Data found that only 44% of Gen Z and 67% of millennials believed that violence against elected officials was never acceptable, compared to nearly 90% of older generations. This data wasn’t broken down by gender, but I had my suspicions that I then went and confirmed with this chart from Gallup.
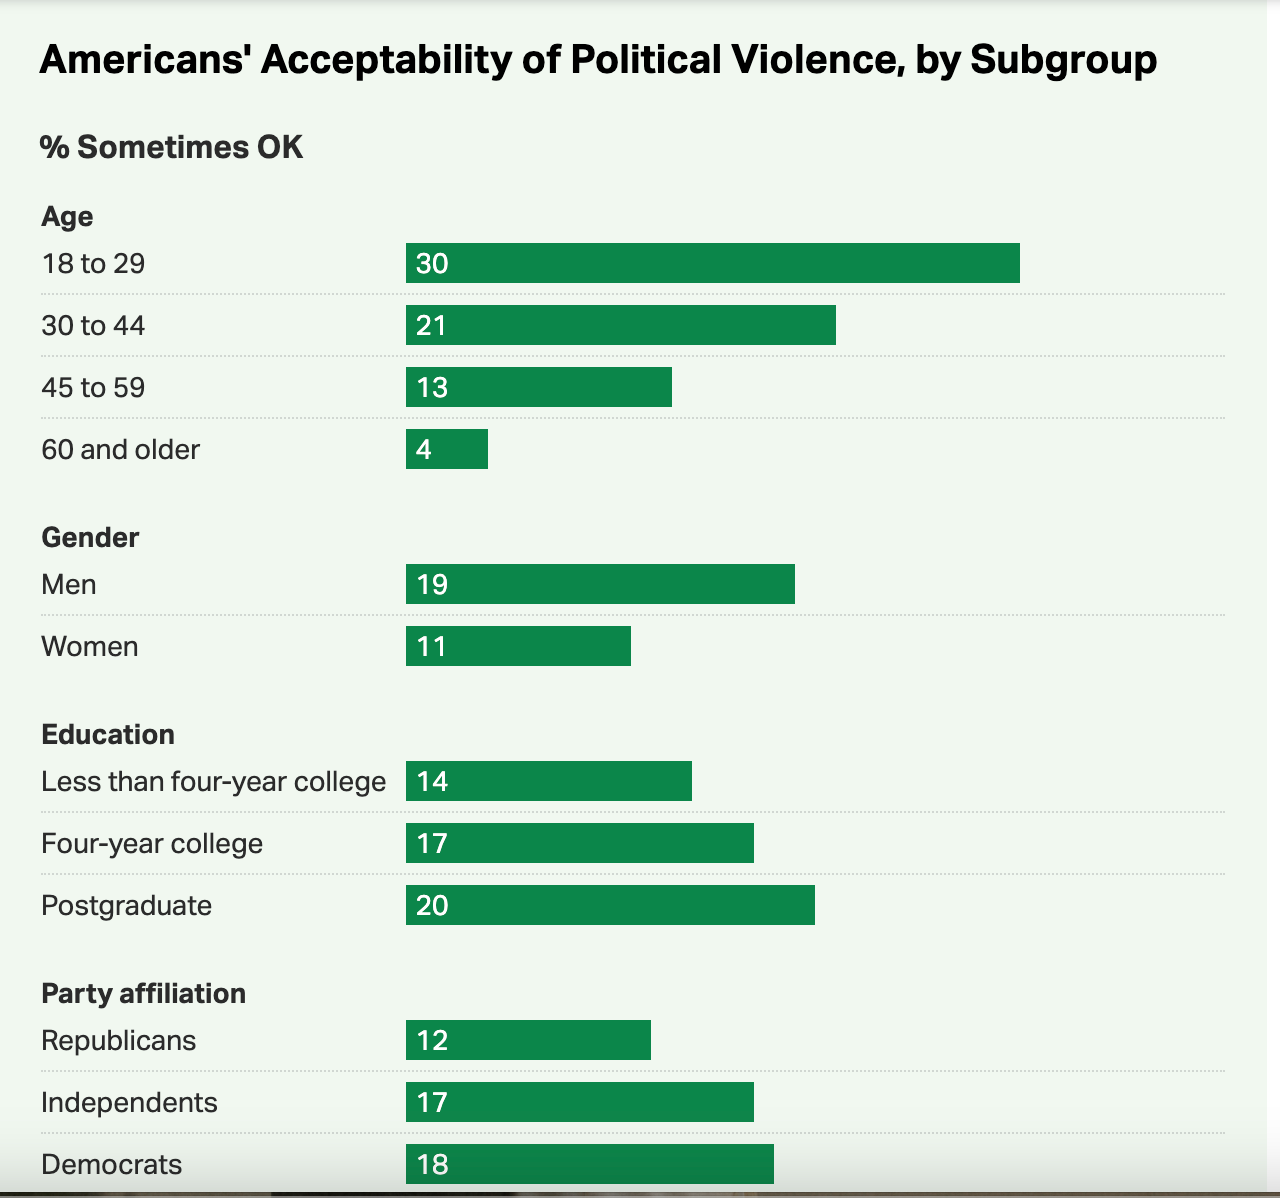
So young men have seen a rapid increase in their belief that women should not have basic rights and their support for political violence. Meanwhile, women have increased their support for rights over their own bodies and their belief that the environment is pressing concern. And we’re supposed to believe it’s women whose view shifts are alarming? Come on.
The reality is women are moving to the Left in reaction to what’s happening on the Right. Plain and simple. Once that shift occurs, it makes sense that they would increasingly align their views with their new tribe as a form of in-group signaling—which the Left practically demands. The Right will take anybody, literally anybody (but especially D-list celebrity converts) whereas the Left looks upon Johnny-come-latelies with distrust and demands a certain level of public self-flagellating and proof of devotedness in order for them to be accepted. Naturally, once a woman (or anyone else) leaves the Republican party her views are going to become more left-leaning, just as we see happen when people switch parties to join the Right. Do you think Joe Rogan started out advocating for people to drink horse drugs?
I’ve gone through part of this experience in leaving the GOP as a woman. It’s tough to stay independent. You get absolutely no credit for it—both sides just consistently accuse you of being on the other team anyways, and you have no community of support either. It’s easy to understand why most people, when turned off by one party, run head first into the arms of the other. I simply knew too much about both sides by the time my departure happened to do so.
Women are right to flee a GOP that embraces Trump and his ideology. He’s a disgusting pervert at best and more likely an actual rapist. His policies hurt women and do not address any of the things they care about, nor do they provide a better economic outlook for them. On top of that, the party has made it clear that the male voter base, including and especially the kinds who are becoming more extreme, are its priority. Why would Barbie choose to live in Ken’s filthy Mojo Dojo Casa House. Ew. Hard pass.

This reaction to what’s happening in the GOP (and in the country more broadly) isn’t emotional, it’s highly rational and logical. No sane person would align with a movement that hates them, or at the very least, promotes people within it who do. Castigating women for fleeing this garbage is like criticizing a woman for running down a dark alley.
Ultimately, all the Gallup survey really found is that women are trying to get away from a subset of men that are doing tremendous damage to our country, our norms, and our security. Instead of developing some self-awareness and addressing these realities, that same population wants to demonize women for not going along with it.
On the Gallup chart about supporting political violence, doesn’t this go the opposite direction you implied? The chart implies that the demographic most likely to support political violence (if we take the top of each) as young Democratic college-educated men - presumably NOT the same demographic of men who think women should not have rights. This sort of aligns with what we saw during the 1960s anarcho-communist movement, and seems like a separate trend from both the “conservative men” and “liberal women” trends.